Gradient · Coming soon
Forecasting crash risk on Florida's roads
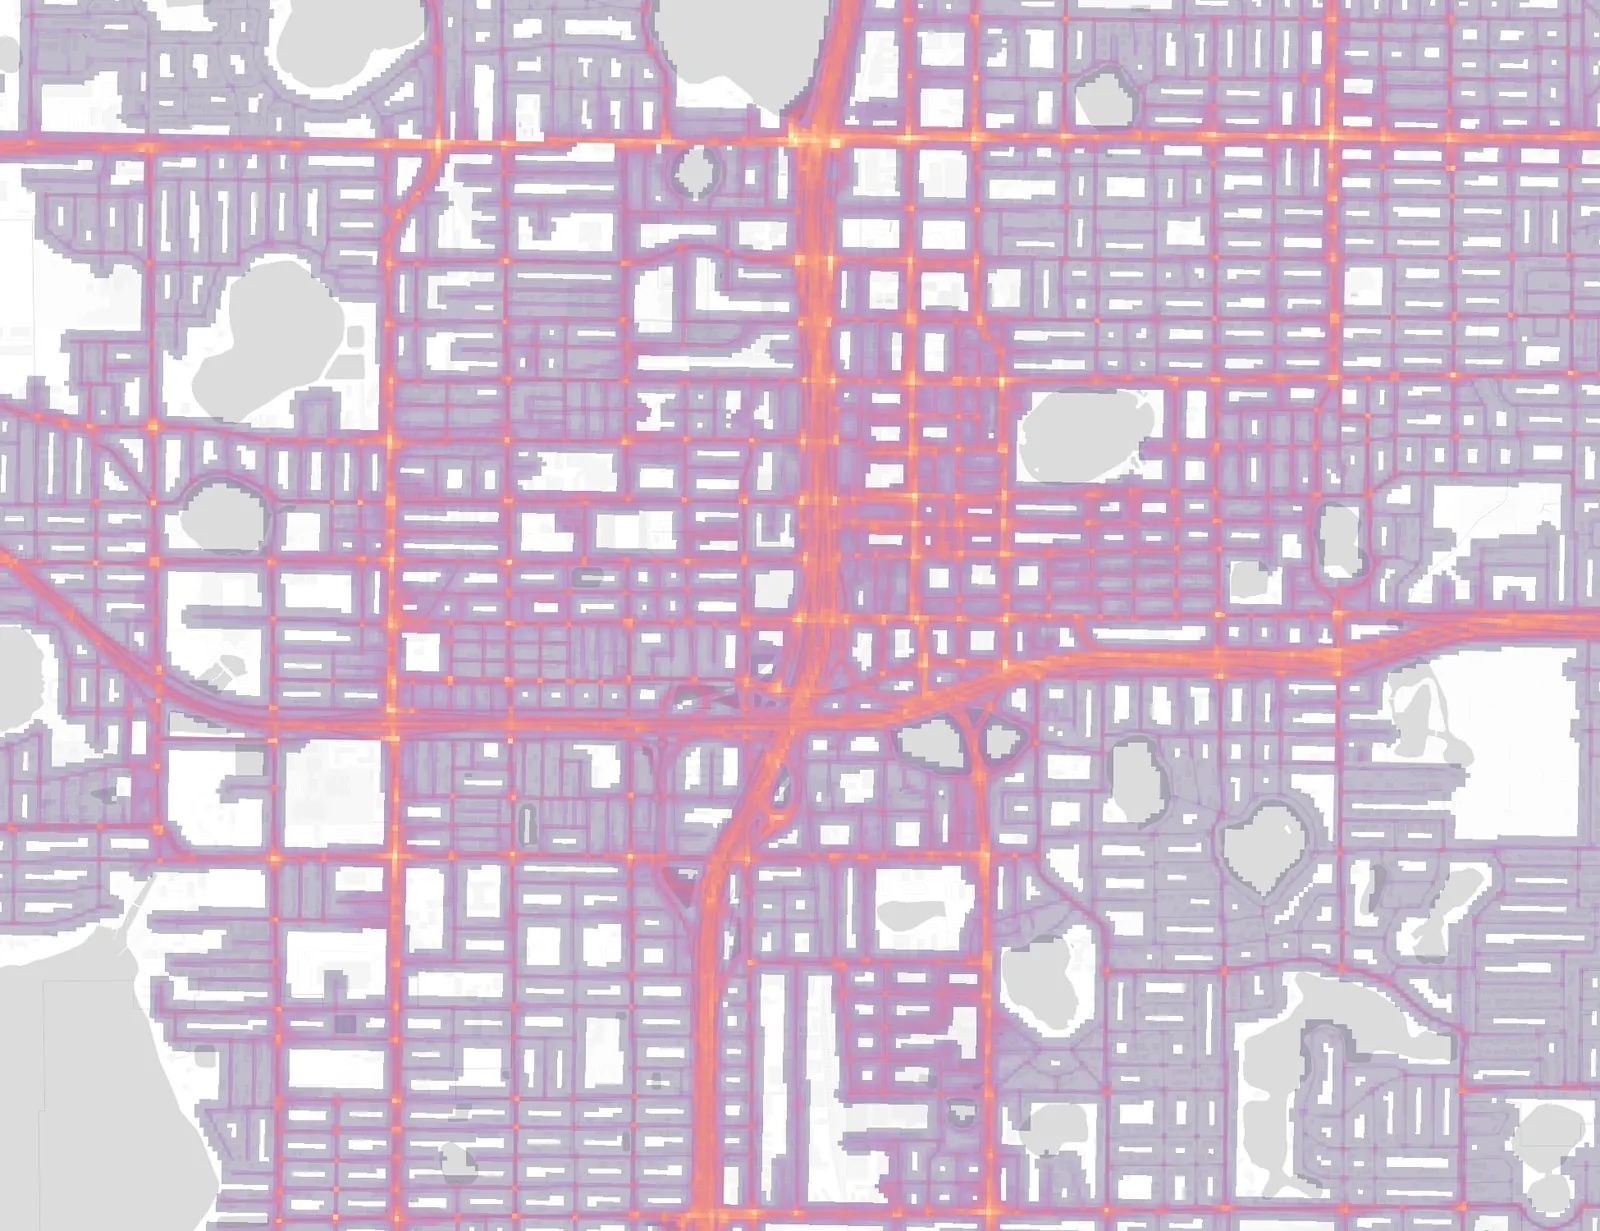
Gradient V1 predicts risk on every public road in Florida. Now forecasting 2026–2028.
Basemap © OpenStreetMap contributors.
The problem
Screening waits for crashes to pile up.
- 90.2% of Florida's road miles get no statewide site screening.
- 39.5% of fatal and serious-injury crashes happen on those roads.
- 1 in 7 crashes happen where none happened in the past four years.
Crash history can't see these places until someone is hurt.
Sources: FDOT Certification of Public Road Mileage, as of Dec. 31, 2025 (State Highway System: 12,287.0 of 125,157.6 public road miles); FDOT STRIDES 2 Zero 2026 Network Screening Report, p. 3; Florida HSIP 2024 Annual Report (FHWA), p. 22. 39.5%: LABBRA analysis of Signal Four Analytics fatal and serious-injury crashes off the State Highway System, 2023–2025. 1 in 7: 2023–2025 crashes in LABBRA's test areas statewide.
How it works
A three-year risk forecast for every road.
Gradient is derived from traffic, crashes, and the road network. Street detail for cities, segments for the state.
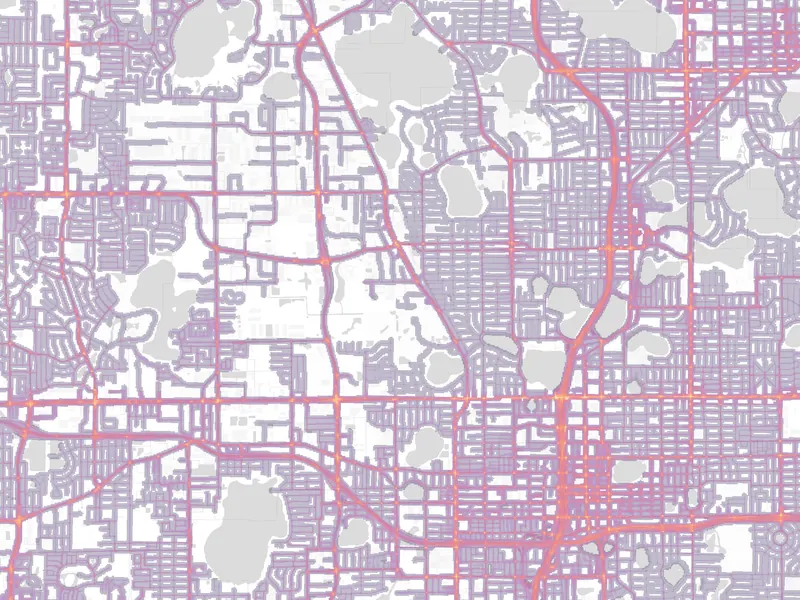
Corridors I-4, Orlando 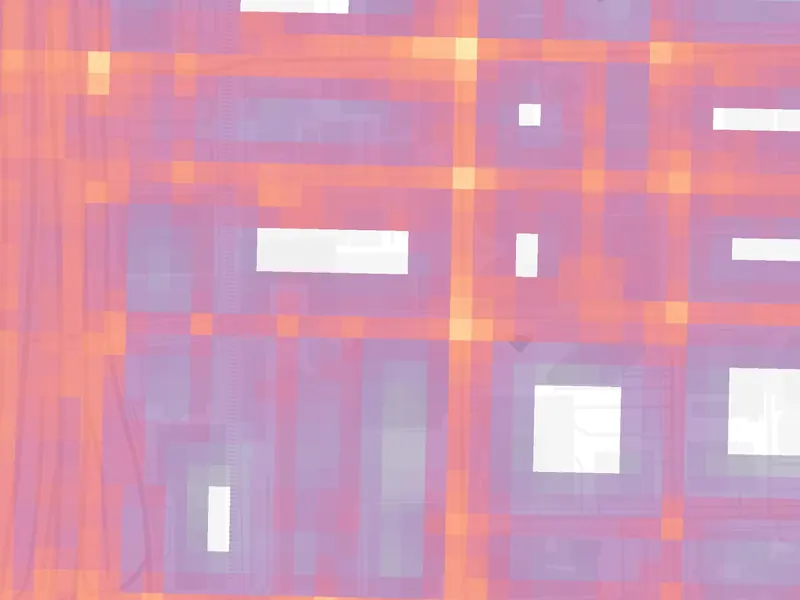
Streets Downtown Orlando 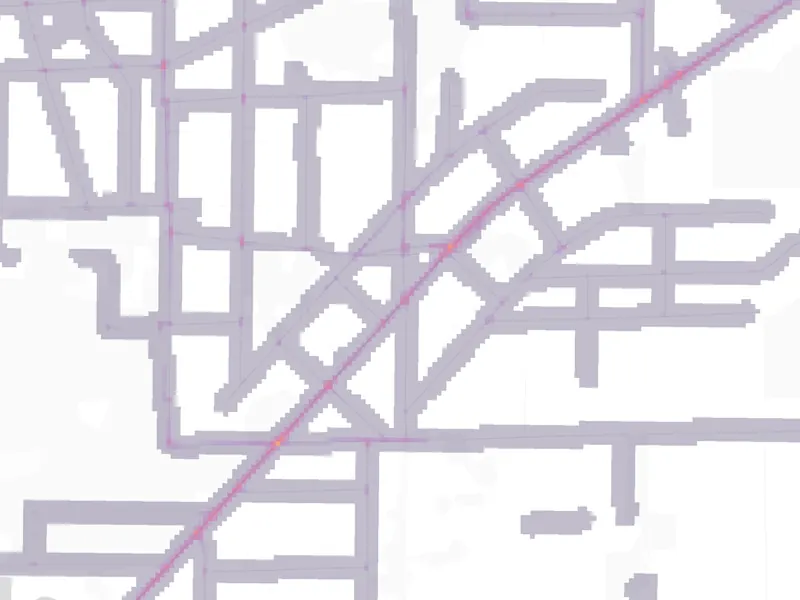
Rural roads Alachua/Levy area
Lower riskHigher risk
Gradient V1 risk maps, 2024–2026, made from 2020–2023 data. Basemap © OpenStreetMap contributors.
Statewide
Every public road in Florida.
Interstates, highways, county roads, and local streets. Same model, every city.
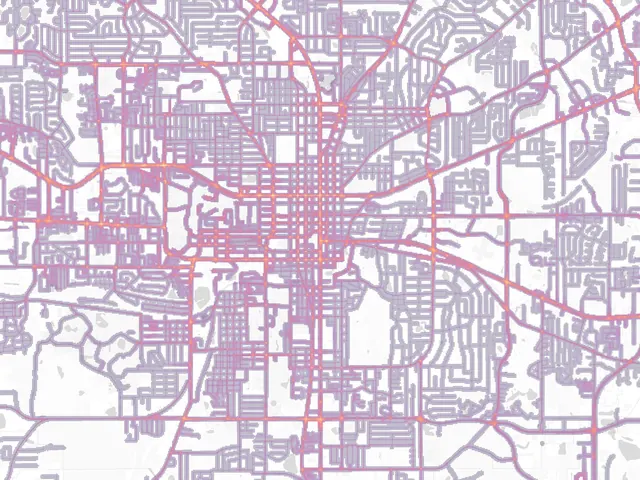
Tallahassee 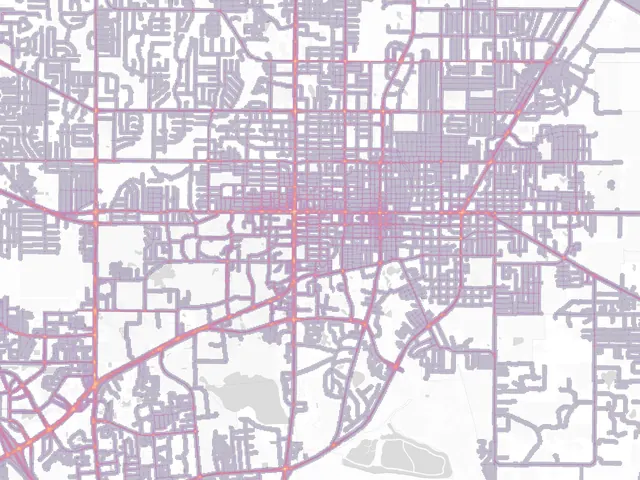
Gainesville 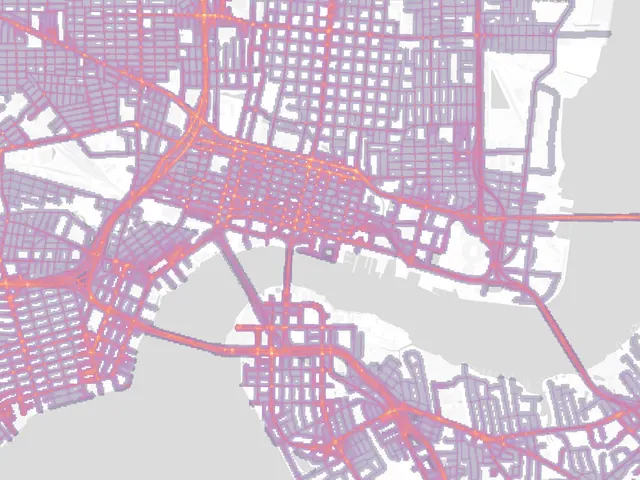
Jacksonville 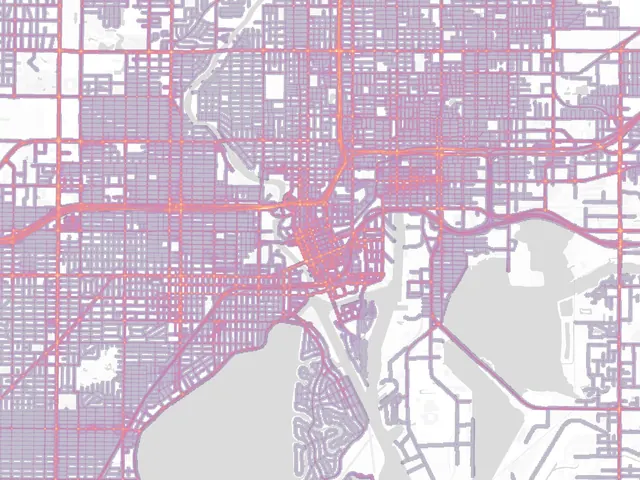
Tampa 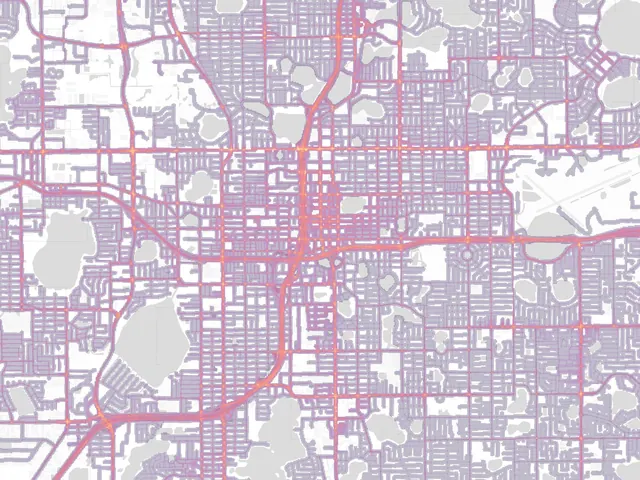
Orlando 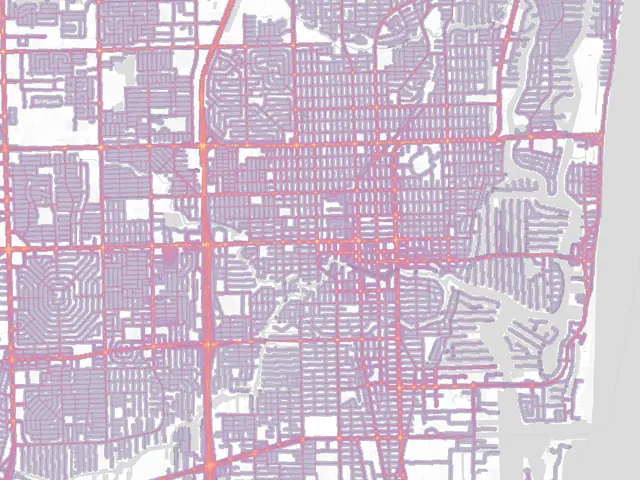
Fort Lauderdale 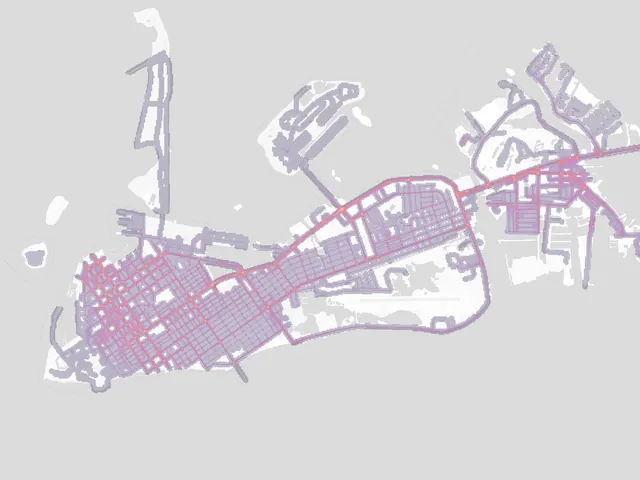
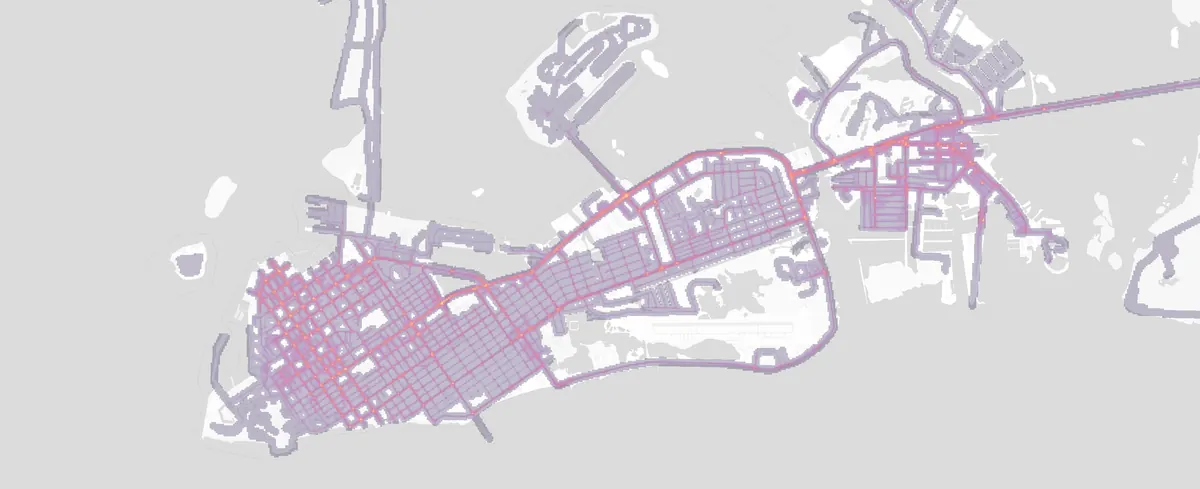
Key West 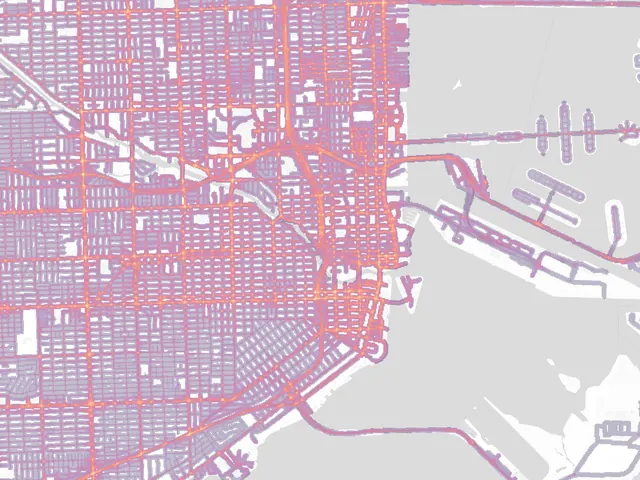
Miami
Gradient V1 risk maps, 2024–2026, made from 2020–2023 data. Roads: U.S. Census Bureau TIGER/Line. Basemap © OpenStreetMap contributors.
Where we are
Working today, building next.
Today
- Risk maps for every public road in Florida
- Tested on held-out areas statewide, 2023–2025
- Forecasting 2026–2028 now
- Built on FDOT crash data (Signal Four Analytics)
Next: the Gradient dashboard
The riskiest sites for the next three years, and a first draft of your grant application.
Riskiest sites, next 3 years
- [Intersection 1]Very high
- [Intersection 2]High
- [Segment 3]High
Draft grant application
Gradient is coming soon.
Book a meeting or email us to learn more.